Pizigani 1367 Chart
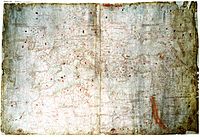
The Pizigani portolan chart of 1367 in a computer enhanced image of reduced resolution (1 MB).
(Full 10 MB Version)
The AD 1367 Pizigani (Pizzigano) Italian portolan chart was drawn in Venice and is today in Parma, (BR ms. Parm.1612). It is
- the largest early chart,
- has the most topographic features and legends,
- has some unique geographic details,
- and may be a unique copy of a lost early 13th century portolan chart.
Metrics
The chart size is according the literature
- Nordenskioeld (1896): 134 x 90 cm
- Stevenson (1913): 138 x 92 cm
- Pujades (2007): 128 x 87 cm
The scale of the Mediterranean basin is about 1Â : 4.9 Millions. According Pujades (2007) who created the most complete collection of early portolans it is the largest chart before 1400.[1] No one yet took measurements of the circle radians to determine any shrink of the parchment.
Â
Preservation
It is as "ms. Parmese 1612" at the Biblioteca Palatina of Parma, Italy. The date of acquirement and the history before is not mentioned in the used literature. In 1913 Stevenson described the chart as "remarkably well preserved."[2]
Only few older portolans are in better condition. The chart is today broken in two parts but by a supporting back kept in correct position close together. Any information loss here is unlikely and the Jomard reproduction of 1849 shows no break.
At Jomard the outer edge was intact with only few losses. Today the edge has several losses usually some cm long and typical up to 2 cm deep. But at the northern edge where Jomard has small losses it is today up to 6 cm deep. It seems some of the area lost was marked grey by Jomard. That may indicate a fungus problem what could spread rapidly but is well possible to control today. By that parchment loss from the time of Jomard there was some textual loss too. But compared to the text volume of the whole chart it is very minor.
There seems to be no important loss of information inside the map. In area where the ink seems faded out this is mainly a contrast and resolution issue of the photographic reproduction technique. To capture the whole map even professional equipment reaches the technical limit. For coastline or text details a close up is still the only possible way.
Â
Â
Reproductions
The first known copy was done in 1827 as a present for Maria Luisa, daughter of the Austrian Emperor and widow of Napoleon Bonaparte. It is in the Nationalbibliothek of Wien, Austria.[3]

The portolan in unprocessed view and the copy by Jomard.
The most important reproduction was the black and white hand lithography by Jomard in 1849.[4]
Edmé François Jomard (1777-1862) was a leading French engineer, archaeologist and cartographer. The high scientific standards known for his edition of the "Description de L'Egypte" he applied for this reproductions too. By comparison with close up photographs Jomards reproduction of the 1367 chart and of the Carte Pisane seem very accurate. All text and graphic is well visible. It was used for cartometrics. All reproductions of the 20th century were of much inferior quality and almost useless for scientific purposes.
The best modern photographic publication is on the recent DVD by Pujades of 2007. It gives a very good impression of the whole chart general look but it has no export function and is not of sufficient resolution for all detail investigations.
The image I spend here for Wikipedia is the most detailed published so far. It is from a professional chemical large format camera, But even this equipment was not able to produce an image in the necessary adequate contrast and resolution. It was scanned and image processed to reveal the most detail. Compared to the original the contrast is enhanced and the colours are darker. So for details and cartometrics the edition of Jomard is still unchallenged.
Â
Â
Authors

The controversial authorship inscription at the eastern edge.
Nordenskioeld reported this authorship inscription on the 1367 chart:
- "MCCCLXVII. Hoc opus compoxuid franciscus pizigano veneciar et domnus pizigano In Venexia meffecit marcus die XII decembris."[5]
Fischer reported an observation by the Parma librarian Odorici in 1866 that Domnus may stand for Dominus, meaning "Priest" and the next word be "(Ge)rardus" pizigano.[6]
Fischer further mentioned a very interesting observation by Desimoni in 1877. He read "Dominicus" and suggested that Francesco Pizigano was the son of Domenico Pizigano who was already dead in 1367. Desimoni pointed to a map of the Holy Land of 1350 by Marino Sanudo preserved in the BNF Paris. In the legend of this map Marino Sanudo is named and a Dominicus Pizigano. It is interpreted that Dominicus Pizigano was the artist of Sanudo who was already several years dead in 1350.[7]
A Pizigani link to Marino Sanudo is important. Sanudo is suspected to be the key person in the creation of the first portolan chartmaker school. It was there in Venice by the Vesconte family were the first dated portolan was produced in 1311. Sanudos main effort was to promote a new crusade to the Holy Land. The Cortona chart, besides the Carte Pisane usually suspected to be the only pre 1311 portolan, belonged to an unknown group with the very same intend.[8]
Because all researchers so far used only their eyes and the ink degraded by time, this older readings had some value. The problem calls for modern equipment. But the problem is not only readability. Besides the 1367 chart they only produced an atlas in 1373 what was not geographical related with the chart.[9]
The atlas has this authorship inscription:
- "MCCCLXXIII adie VIII de zugno Francischo pisigany venician in Venexia me fecit."
From all this poor spelling and grammar there evolved the opinions that the 1367 chart was drawn by the brothers Domenico (and or Marco?)[10]
Pizigano and Francesco Pizigano. As plural of Pizigano it is usually called the Pizigani chart.
For reasons not mentioned[11] Pujades, a palaeographer, used Pizzigano instead of Pizigano. This inevitably draws a link to another chart of 1424 signed "Zuane Pizzigano".[12]
According Pujades, it is assumed as probable that Zuane was the son of one of the two aforementioned.[13]
This 1424 chart is much better known to the broad public because it has two large islands, one called "Antilia", in the Atlantic east of the Azores. The leading Portuguese historian Armando Cortesao saw it as "intended to represent the easternmost part of the American hemisphere" and it may indicate a discovery of America before Columbus.[14]
According Pujades the 1424 map is the oldest extant "medieval Atlantic partial chart"[15] and was the first time the island Antilia was on a map,[16] but followed soon by other portolans. As we see below, other historians saw the whole Antilia problem already raised by the Pizigani chart of 1367.
Pujades, a palaeographer, considered the Piziganis writing of "limited technical training" and "the lettering of both works [of 1367 and 1373] ... is characteristic of people in the habit of writing though not of true professionals experienced in copying books or documents in good calligraphy." The "exaggeratedly high degree of spelling variations when it came to writing place names" suggests they had no training as cartographers either. They were probably not of high cultural level.[17]
Their authorship inscriptions of "both works reveal that they knew very little Latin grammar and orthography." But the many topographical legends on the 1367 chart were in such much better Latin that he is sure they copied it from somewhere. Pujades noted on the 1367 chart, after writing the names in black ink, they forgot the name of Valencia on the red run.[18]
Â
The Source Author
Nordenskioeld noted: "It is perfectly impossible to decide the age of portolanos by their style, for even the hand-writing is slavishly copied."[19]
If the Pizigani brothers really copied the hand writing it may give a palaeographic link to the author of the source map. But there is another link too. The Latin of the map legends used abbreviated wording like known from books where writing space is limited.
The abbreviations changed by time and cultural milieu. The source writer was an educated trained clerk in an office of a government or governmental like organisation and cleared for secret high level documents. He was active sometime in the 1180 to 1265 timeframe. There were not many people like him and the number of extant documents from this time is limited. There could be other documents by his hand or the abbreviations scheme may point to his educational or operational peers.
Â
The Content in Context
The Pizigani brothers chart of 1367 was the first Venetian portolan after the last Vesconte production in 1327.[20]
It is ornamented in the Catalan style. But the Pizigani brothers were Venetians and the atlas six years later is typically Italian.[21]
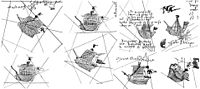
Some of the ships in redraw by Jomard.
It is the first chart that introduce the representations of ships.[22]
The chart had the Nile send one arm to the west in the Atlantic. This was based on classical sources and was Arab opinion since Masudi of 10th century.[23]
It is the first mention of the Hoggar or Ahaggar mountains ("Uggar") in the central Sahara.[24]

The "bookish" mappamundi.
Pujades noted a 3 cm diameter "diagrammatic circular mappamundi", a mini schematic world map north of Damascus. Such a sketch map one "would hardly have seen anywhere other than in the Latin bookish milieu."[25]
Already Lelewel in 1852 noted the similarity of the legends of the Pizigani 1367 chart with the Atlas Catalan of 1375 and suggested a common source.[26]
Pujades suspected a dependence on Dulcert's[27] 1339 portolan. Some decoration[28] and the explanatory legends are similar but more were on the 1367 chart.[29]
The poor Latin the Piziganis did in their authorship inscriptions makes it impossible that they created this additional legends.[30]
Instead they simply copied it. The source they used was a map from with later copies were the source for Dulcert.[31]
Â
Â
Hercules or Antilia?

The "strange Figure" and the controversial Hercules Antilia legend. (Jomard)
This chart is known to several historians only by an inscription at its western edge north of the "Azores". The German historian Richard Hennig, a specialist on the history of early discoveries, devoted it considerable attention.[32]
He came to the conclusion that the inscription tells about columns that were from the temple of Hercules. The sea is save till here but beyond these statues sailors cannot navigate.
Most others, since Buache in 1806[33] read something like Antilia instead of Hercules. In 1977 Kare Prytz was able to have it photographed with the assistance of a Mr. Odd Wibe of the Norwegian embassy in Rome. Prytz, in his famous and important book on Vinland[34] came to the conclusion of Antilia too.[35]
Hennig had several points of argument[36]but wrote he and his supporting palaeographer were only able to use a reproduction.[37]
So the question whether this chart is the first mention of "Antilia" should still be open. Because it is not a simple matter of reading it should be investigated by modern means.[38]
Some attention should be devoted to the "strange" (Hennig) figure close by pointing to this inscription. It is without parallel on portolans and reminds somewhat on medieval book decorations. It has some letters in the ornament and probably a message still to get.
Â
Â
The Winter Opinion
The most outright opinion on the chart was by Heinrich Winter. After reviewing the early portolans on topographical and descriptional details, he concluded:
- "...the development of the portolan map which reached its highest point with the Pizigani map of 1367, since as early as the Paris Atlas [Catalan of] 1375, the topographical content, covering the same area, begins to deteriorate steadily."[39]
Campbell (1987) mentioned Winters conclusion and called Winter an authority.[40] Indeed there is supporting evidence below that the coastline of this chart had some solely outstanding features.
Â
The Fischer Opinion

Theobald Fischer discovered a crucial feature on this chart.
After some progress in the technique of photography in the second half of the 19th century, the Venice publisher Ongania decided to create the first collection of photo reproductions of Italian portolans, the "Ongania Collection".[41]
The famous German geographer Theobald Fischer (1846-1910) supported the edition and wrote a commentary supplement in German.[42] It was considered of such importance that it got reprinted in the Netherlands in 1961.

Fischer in 1881 noted the high similarity of the wrong complex river systems on portolans in the Near east: Jordan, Euphrat/Tigris and Karun.
Fischer spent a lot of time with Italian originals and literature on portolans. Regarding the maps in the Atlante Medicea Laurenziana ("Medici atlas") of 1351 he mentioned the striking similarity of a lot of sea and inland features, specially some fictitious rivers, with other early portolans. It is not in the Ptolemy tradition and he saw too much similar details to assume a textual common source. So he concluded that the world map in this atlas, the Carignano map of c. 1310, the Pizigani of 1367 and Cresques` Atlas Catalan of c. 1375 had all to be copies from one common source map.[43]
So by focusing on the inaccurate features Fischer (1886) came to the same conclusion of a common source like Nordenskioeld (1889). But in contrast Nordenskioeld focused on the remarkably accurate coastlines.
The Fischer Discovery

The conquerors flags over Constantinople point to a portolan of around 1210. First discovered by Fischer in 1881. Left Jomard, right photography enlargement.
One of the most important discoveries on portolans did Fischer during his work in Italy. He noted on the Pizigani chart of 1367 over Constantinople the flags of the crusaders and the Venetian winged lion of San Marco. This were the forces that invaded Constantinople in 1204 and kept it occupied. They created the "Latin Empire of Constantinople" that lasted till 1261. So Fischer concluded here the Pizigani was a copy of a chart that was created during the Latin Empire of Constantinople (1204-1261).
This Latin Empire got its own flag different from the invasion forces. Therefore the crusaders and Venetian flag at Constantinople may indicate a time closer to the invasion date in 1204. In a journal article Fischer too argued that the date was probably soon after 1204.[44]
Fischer argued that it was unthinkable for the Piziganis as Venetian cartographers to place a Venetian flag over Constantionple in 1367 were already the Genoese were the supreme power there.[45]
Fischers discovery makes the portolan charts almost 100 years older than usually thought. This find is still known in German literature[46] but never mentioned or even discussed in English ones. This text here may be the first time. As one authority suspected, it may let the bottom fell out of most portolan research. But on a second look it is somewhat less dramatic:
- The Pizigani 1367 has two small coastline errors that were corrected in all other portolans (see below). Therefore some development still happened after its source was drawn.
- There is consensus that the coastlines deteriorated from the 14th to the 16th century. The begin of this may just be somewhat earlier than assumed by current opinion.
- A highpoint of portolan development around 1200 is more convincing as one around 1367. Because it would point to a find from classical times and render the medieval portolan development rather to a copying effort with only local (names, bays, reefs) improvements. Otherwise one had the hard to explain problem how a development could rise till 1367 and decline afterwards - a movement just opposite to the epoch of scientific improvements that began then.
- The development of the regional schools (Venice, Genoese, Catalan) may simply reflect the availability of source maps. That the Pizigani was in Catalan style shows this school closer to the source. This supports the view of Nordenskioeld who suspected the origin of portolan development by the Catalans.
Â
Pre Discoveries

The north Atlantic relations of the chart.
Cape Bojador
Fischer mentioned in his 1883 article that another author had good reasons to consider the whole 1367 chart a modern fake. West Africa extends further south than any other map before (except the world map of the Medici atlas), perhaps even to Cape Bojador. But this Cape was first known from the 1375 atlas Catalan. A river "fluvius Palolus" near Cap Bojador on the 1367 chart was interpreted to derive from "pajola" for "Gold". in the world map of Fra Mauro is Gold as "oro di Pajola" mentioned near that river.[47] In his 1886 book he did not repeat any suggestions of fake but pointed out the similarities to other charts are indications for a common source.
If the Medici atlas is not by 1351, then the Pizigani of 1367 is the first map that mentions Guinea ("Ganuya"). Hennig assumes knowledge was spread by land and Cape Bojador was not circumnavigated before 1434.[48]
Â
Canaries
The Canaries were first documented in 1336[49] and should be no surprise on a 1367 chart. But here the island group has the typical portolan rotation error of around two nautical points (22.5°). This error here has important implications.
The rotation errors of coastline parts found in Mediterranean and northern portolans point to a transmission history were something like an encrypted map, a cipher map, was involved. Mistakes during the compilation from such a cipher map created this errors. It seems all past 1306 Mediterranean portolans have the same rotation errors and therefore belong to the same compilation. This compilation happened therefore in the 13th or even 12th century.
To get this error the Canaries had to be present during this compilation. So they were on a map about 100 years before the official discovery. The other implication concerns the Fischer discovery. The rotated Canaries tell that not only the area around Constantinople was copied from map of c. 1210. But the Canaries too and therefore probably the whole chart.
Â
Azores
In the Atlantic the chart has the Madeiras and Canaries island archipelago at roughly the correct positions. In the west at about the latitude of the Azores there is an island named "insula de bracir". Cortesao suggested it to be Terceira, one of the larger islands at the center of the Azores group.
By correct rotation of the Atlantic chart part to the equirectangular projection this island is with really good accuracy direct on the parallel of the main Azores island Sao Miguel. Cortesao claimed that the Azores, the Madeiras and the Cape Verdes islands were depicted on charts a considerable time before their first mentions in the archival record.[50] Cortesao reported the first definite knowledge of the Azores by 1427, Hennig by 1432.
Â
Newfoundland
North of the possible Azores is another island at the latitude of Newfoundland. At Newfoundland was the European settlement site of L'Anse aux Meadows, discovered in 1960. According C14 data it was occupied around 1000. According several historical records the land "Vinland", somewhere south of Newfoundland, was discovered around this time. According the records Vinland was visited by Europeans for over 400 years.[51] The last known record that mentioned current Vinland voyages is a German one of 1434.[52]
So the chart may show the most eastern island of the American continent. It certainly shows the European latitude one would have to run for the shortest way to cross the Atlantic.
The questions seems valid why only Newfoundland was on the map and - except the Hercules or Antilia issue[53] - no hint of the American continent.
Most records of sailings along the American east coast down to Florida[54] were in Norse language and at first probably in rune writings. This language barrier and the distance from Norway to Italy is the usual explanation why America was unknown in the south of Europe. But that is not correct. The German bishop Adam of Bremen reported the discovery of Vinland in a Latin book of 1072 about geographical and historical matters. Greenland, where the voyages started, had an operational bishop seat in Gardar since 1112 and the first bishop there did even a voyage to Vinland.[55]
It was the foremost duty of a bishop to report all important news to the the Vatican and therefore at least some in Italy were well informed on the new land in the west. The only explanation for the lack of public knowledge seems to be a strict secrecy order. The warning about voyages west of the "Azores" on this chart may well due to such an order to deter any uninitiated casual reader or chart thief.
Â
Conclusion
These islands (Newfoundland, Azores, Madeiras, Canaries) are the only islands in the Atlantic there. Only close to and around Ireland and Great Britain are further real or fictive islands. That is in strong contrast to some other alleged pre-discovery maps like the more famous "Zeno map" filled with islands. This changes much the statistical viewpoint in favour of real islands on the 1367 chart.
But for the most controversial, the Azores and Newfoundland, even the latitude of the island position is correct. The Azores main island latitude is hit within a fraction of a degree. At Newfoundland the center of the island is hit. This all left no doubt that those "pre discovery" islands are on the chart.
It seems inevitable to accept that the chart has Atlantic islands information that could not be from known Italian discoveries. Neither from Spanish or Portuguese ones, because their age of discovery started later.
Â
Â
Cartometric Analysis
Based on Jomard a cartometric analysis was done much like described for the Carte Pisane here. The coastline was corrected to a mathematical perfect rhumb net, vectorized and the 10868 vectors distorted to fit an equirectangular projection for 35° North. This type of projection was chosen for simplicity.

Cartometric analysis over all.
The over all match of the Normal portolan area (Atlantic, Mediterranean, Black Sea) has a an average difference error (RMS) of +-55.4 km or 1.5Â % the wide of the Mediterranean. In other words, if the portolan coastline is placed over a modern map, the gap between the lines is typically 55.4 km or 11.3 mm on the 1367 chart. The whole span of the analysed chart, from the African cape near the Canaries to the eastern Black Sea, is 5360 km and the 55.4 km are only 1.0Â % of that span.
The error difference along the coastline goes from 0.38 km to 259 km. The average rotation is 10.5°. The largest errors are in the Atlantic, Syrte and Black Sea. Except Africa southwest of Crete, the result is very typical for a portolan. For comparison, the Dulcert of 1339 has +-63.7 km and 10.4° rotation.

Cartometric analysis Mediterranean part
The Mediterranean basin had an error of 40.3 km (8.2 mm, 1.1 % total basin wide) and rotation of 9.8°. Dulcert had 43.5 km and 9.9°.

Cartometric analysis Black Sea
The Black Sea alone had 25.0 km (5.6 mm), 10.2° rotation and about 109 % the scale of the Mediterranean basin. Dulcert had 22.4 km, 9.2° and 110.8 % scale.

Cartometric analysis Atlantic part
The Atlantic alone had 28.6 km, 4.9° rotation and 85.2 % scale of the Mediterranean. Dulcert had 34.6 km, 4.6° and 83.8 % scale. The Atlantic going from c. 26°N to 51°N (2780 km) is better than the Dulcert one, specially around southern England. It is with an average error of 4.9 mm of such a good fit that one may suppose the original projection not to be far away from the chosen one.
That Atlantic and Black Sea on all portolans were of different scale than the Mediterranean is known at least by Wagner (1895) for over 100 years. If the Atlantic is corrected in scale and rotation to the Mediterranean it results in an average error of 38,67 km. Added a corrected Black Sea results in an average error of the whole chart of 36.55 km. That is 7.5 mm on the one meter size chart.
This whole chart goes from southwest England to the southeastern Mediterranean over 4000 km, of which the 36.55 km are only 0.9Â %. From the African cape near the Canaries to the eastern Black Sea its 5360 km and the 36.55 km are only 0.7Â %. Compared to other early portolans this chart is the most accurate.

Overview Cartometric Analysis Results
On an etalon analysis with the Pisane, see here.
For a special analysis a detailed distortion grid was created. About the intentions and results see here.
A Certain Projection
The here used equirectangular projection is free of any distortion along the 35° North parallel. Further north the east-west distances get dilated up to 26 % at the 44° N parallel near Marseille. To the south the east-west distances get compressed by up to 9 % at the 32° N parallel near Alexandria.
The cartometrics show that the chart matches this distortions of the projection for the Mediterranean within 1.1Â %. In other words, this distortion of c. +26Â % to -9Â % is already in the medieval chart.
There are several other possible projections with very similar distortions. So by this good match it is still not possible to decide that the now chosen projection was really the one the initial map was based on.
But it is absolute certain that this portolan is based on a projection. It could not be compiled by "flat" planimetric maps. Otherwise the error had to be beyond 30Â % and not as low as 1.1Â %.[56]
Errors and the Transmission Map

Crete on portolans and the North-West bay detail
That portolans are inaccurate at short ranges is known and quite obvious. Less known is the simple lack of some important local features. One is the "U" shaped cape at the west of Crete. All portolans before the 17th century missed it. That despite its size is close to something a navigator could still notice by eyesight without plotting any measurements.
The good accuracy on long ranges and the poor on short ones may be explainable by a bottleneck in the transmission history of the portolans. That all portolans were enlarged copies from one single small map. Maybe this small map was found during the Middle Ages in a book from Roman times. This was first suggested by Grosjean.[57] It would explain the lack of latitude and longitude values too, because such data was of no use around 1200.
Such a bottleneck like transmission map should leave very specific errors in portolans. Small islands would be initially not present. The lot of small islands, coastline details and harbor names of the portolans were then later additions by the Medievals. This improvements could not happened suddenly but by a development. The oldest portolans should have here errors the later ones no longer had. That is the case on this chart.
The Wrong Ionians
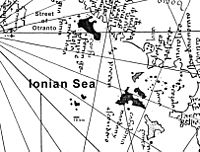
The wrong Ionians islands group east of Greece in the reproduction of Jomard. The scale bar later inserted.
To the west of Greece is the Ionian Sea with several islands. This chart has an unnamed group of five islands well west of Kefallinia (Cephalonia). The largest is about 10 km wide. The local hydrography rules out any past presence of islands there. So it may be a remnant from times were such features were still be added to the portolans.[58]
The Gulf of Tunis

Coastline of several portolans around Tunis / Cape Bon.
Another unique feature of this chart is the size of the Gulf of Tunis. It is almost twice as large than on the Pisane or Cortona and well larger than on any other portolan. It seems to be an over extension corrected on all later charts.
The Gulf of Kos
In the south-west corner of Turkey is opposite the island of Kos a deep gulf up to 23 km wide and 85 km deep inland. This chart is the only portolan that has no Gulf of Kos.[59] This missing Gulf is the largest feature missing on any Mediterranean portolan.
Â
The Gulf of Kos Traditions
It seems the Gulf of Kos was one of the latest features added to the early portolans because we see it introduced in three different shapes. This three lines of tradition could be analysed up to mathematical accuracy. The first and probably oldest tradition (after the none Gulf) features a large upward sling on the Italian portolans of Carignano and Vesconte. From this a round bay evolved on Catalan type portolans like Dulcert, Atlas Catalan 1376 or the Medici Atlas 1351.[60]
The third shape tradition is the most accurate. It is a deep long Gulf and a good Kos island too. Amazingly it is only on the oldest extant portolans, the Carte Pisane and the Cortona. We probably see here the final results of a longer secret improvement effort by people aware of the origin and shortcomings of the portolans. The Cortona chart was a direct work copy of a now lost up to date improvement master map. The Pisane was probably an unauthorized compilation of an atlas version of this last version master map.
Some time after 1300 different development stages of this master map became the sources for the chart makers in Italy or the Catalans of Majorca. The Italians got an early version, the Catalans a later one but none got the last version. The earliest known master map version was the Pizigani 1367 chart.
Â
The Size of the Transmission Map

The Gulf of Kos history and its relation to to a crucial bottleneck like transmission map for all portolans
The Gulf of Kos offers an unique opportunity to calculate the scale and size of the transmission map. This map was too small to show the 23 km Gulf but large enough to show the 27 to 39 km Cape Bon peninsula. A feature like the Gulf will not be drawn if the ink lines were too close together. So we have a direct relation between the width of the ink line and the wide of the Gulf.
If the Gulf is 1 line wide it could not be drawn. By 2 lines wide it could be drawn and by 3 lines wide it probably would be drawn. Cape Bon could be drawn only 1 line wide. But then the outline would not be as complicated like it is. So at least 2 lines or better 3 lines wide were necessary too. On a diagram of scale versus ink line wide we get an upper (red) and lower (blue) area for the size of the transmission map. There is some overlap around a line wide of 10 km.[61]
By the 10 km value for the coast line wide the wide of the ink line in mm determines direct the scale of the map.
A wide of 0.5 mm would be fine for a medieval book letter but rather coarse for a portolan. But most of the somewhat amateurish drawn Carte Pisane used an even wider line. This 0.5 mm would result in a scale of 1Â : 22 Millions. It would be the area of the normal portolan on one DIN A4 book size page. In that case the transmission map would probably be from the page of a medieval codex and present the area of the Roman Empire and the adjacent regions.
For an ink wide of 0.28 mm like used by Carignano and Vesconte (1313), one gets a scale of 1Â : 40 Millions. That is the size of a world map on a 1 meter wide chart. The lower professional limit[62] seems to be 0.21 mm from the portolan of Jehuda Ben Zara (1497). It would be a scale of 1Â : 55 Millions and may represent a world map of 0.73 meter wide.
So this calculations suggest one shall look for evidence whether a world map was ever under discussion to be related to portolans or classical maps.
Notes
- The 1403 Beccari has 139 x 93 cm.
- Stevenson (1913), p. 12
- Georges Grosjean: Geschichte der Kartographie, Bern (1996), p. 20
- Jomard, Edme François: Les Monuments de la géographie ou recueil d’anciennes cartes européenes et orientales publiées en fac-simile de la grandeur des originaux, Paris (1842-62). The Pizigani 1367 chart was of c. 1849 with provisional numbers 44-49 and label X.
- Nordenskiöld (1896), p. 58. As source he gave "(U.-A., II, p. 57.)" what seems: G. Uzielli, P. Amat, Di S. Filippo: Studi biografici e bibliografid sulla storia della geografia in Italia, II: Mappamondi, carte nautiche, portolani ed altri monununti cartografici specialmente italiani. dei secoli XIII-XVII, Roma 1882.
- Fischer, Theobald: "Ăśber italienische Seekarten und Kartographen des Mittelalters." in: Zeitschrift der Gesellschaft fĂĽr Erdkunde, Vol. 17, Berlin (1883) p. 35
- According Fischer Sanudo was active as writer in 1306 and last recorded in 1334.
- Campbell wrote: "Caraci suggested that remarks about Palestine, written in an old hand on the reverse of the [Cortona] chart, were reminiscent of proposals for a crusade made at the Council of Lyons in 1274." Campbell (1987) p. 402. Caraci, Giuseppe: Italiani e Catalani nella primitiva cartografia nautica medievale (Rome: Istituto di Scienze Geografiche e Cartografiche, 1959), 83-187,302-7, English summary on 351-53.
- It covered a similar area but the atlas Gulf of Kos is in Catalan round style and the Gulf of Tunis like in all other portolans.
- Nordenskioeld (1889), p. 58 suspected "Marcus" instead of "Domenico". Campbell "Marco" as alternative to Domenico. Campbell (1987), p. 454
- At least not in the English part of his book written in Catalan.
- According Pujades (2007) the signature of the 1424 chart was subsequently erased and rewritten in contemporary script. It is not known whether Pujades personally investigated this map preserved in Minneapolis, USA. An US author wrote: "the signature, although erased, being still discernible." Enterline, James Robert: Erikson, Eskimos, and Columbus: Medieval European Knowledge of America (2004) p. 161
- Pujades (2007), p. 503
- Cortesao, Armando: The Nautical Chart of 1424 and the Early Discovery and Cartographical Representation of America: A Study on the History of Early Navigation and Cartography (Coimbra: University of Coimbra, 1954), and "The North Atlantic Nautical Chart of 1424," Imago Mundi 10 (1953), pp. 1-13,
- Pujades (2007), p. 473
- Campbell (1987) p. 411 noted: "Although this is the first reference to Antilia on a surviving chart, Pedro de Medina mentioned its presence on a Ptolemy manuscript presented to Pope Urban, evidently Urban VI (1378-89); Cortesao, [(1953)], p. 8"
- Pujades (2007), p. 494
- Pujades (2007) p. 480f
- Nordenskioeld (1896), p. 58
- Pujades (2007), p.494
- Campbell (1987), p. 393
- Pujades (2007) p. 482f
- Hennig: Terrae Incognitae, Vol. 4, (1956), p. 116
- First noted by Charles de la Ronciere: La decouverte de l'Afrique au moyen-age, Kairo (1929), Vol. I, p. 114. Reported by Richard Hennig: Terrae Incognitae, Vol 3, (1953), p. 428
- Pujades (2007) p.517
- According Fischer (1883), p. 27
- Pujades reading of the name is "Angelino Dulceti" or "Dulceto". Other authors before read "Dulceri", "Dalorto" or "Dulcert". Pujades (2007), p. 490. Here the reading of Dulcert is used to avoid confusion because it is the most used version in all past portolan literature so far.
- For example in Africa a camel driver and the elephant carrying a castle on its back. But this castle on the Pizigani elephant is more realistic than any other. It shows three persons, one on a tower and two lower with signal horns. It makes sense as a command and control station on a battlefield. All others only had some castle with buildings, towers. Like a miniature of something. It seems the real details were lost in copying and the 1367 chart was the most close to the source.
- Pujades (2007), p. 482f
- Pujades described the legends as "a Latin which, though modest, is not particularly crude considering the place and time," but "on the other hand, the authorship inscriptions of both works reveal that they knew very little Latin grammar and orthography" and concluded they copied the legends from somewhere. Pujades (2007), p. 494
- The map of Dulcert has some coastline improvements (Gulf of Tunis, Gulf of Kos) the 1367 Pizigani had not. To allow steps of improvement, the Dulcert could not be copied from the source of the Pizigani.
- Latest in:
- Hennig, Richard: Terrae Incognitae, Vol. 4, Leiden (1956), p. 291f
- Main palaeographic analysis in: Vol. 2, Leiden (1952), p. 491ff.
- Origin of Hercules columns myth and relation to Azores in: Vol. 1, (1944), pp. 138-154 (Chapter 19 - Reaching of the Azores by the Carthagians and the question of an early knowledge of America).
- Not consulted: R. Hennig: Aufhellung eines Rätsels der Pizigano-Karte von 1367, in: Forschungen und Fortschritte, Augustheft 1947.
- N. Buache: Recherches sur l'ile Antilia et sur l'epoque de la decouverte de l'Amerique, in: Memoires de l`Institut des Sciences, Lettres et Arts, vol. 6 (1806), 254.
- Prytz, Kare: Westwards before Columbus, Oslo (1991)
- His suggested close relation of the Pizigani 1367 with a Urban V Ptolemy is not convincing.
- In his presented sources were more than he mentioned or he was aware of.
- It was probably Jomard. He presented a part from Jomard in his 1956 book. But it is not clear how good this letters were visible in 1848.
- By detail infrared photography the ink line could be determined. By palaeography than the letters, the abbreviations and the probable text meaning. This is no simple task because every step from writing, abbreviations, spelling and grammar may contain some errors. The medieval writers were not perfect. The best source to compare are foremost the other chart legends. Like mentioned above, after all legends were catalogued it may be a base to identify the source author too.
- Winter, Heinrich: "Catalan Portolan maps and their place in the total view of cartographic development", Imago Mundi, Vol. 11, 1954, p. 7.
- Campbell (1987), p. 327
- Fischer, Theobald (Ed.): Raccolta di mappamondi e carte nautiche del xiii al xvi secolo, Venice (1881)
- Fischer, Friedrich Theobald: Sammlung mittelalterlicher Welt- und Seekarten italienischen Ursprungs und aus italienischen Bibliotheken und Archiven, Venedig, 1886. (Reprint: Amsterdam 1961)
- "In der ganzen Darstellung Vorder-Asiens, in der Gestalt Arabiens, des Rothen Meeres, des Persischen Golfes, des Kaspischen Meeres, der mesapotamischen Flüsse, der zwei Seen, aus welchen der Karun kommt, stimmt unsere Karte so genau mit der der Pizigani und der katalanischen, zum Theil auch mit Carignano überein, dass von einem Arbeiten etwa nach gemeinsamen Quellen, nicht die Rede sein kann, sondern, dass entweder alle drei eine gemeinsame ältere Vorlage copirt haben, oder, was wahrscheinlicher, die Pizigani und der katalanische Kosmograph unsere Karte copirt haben." Fischer (1881), p. 131
- As a more probable alternative he suggested all were copies from the 1351 atlas maps. But that is impossible at least for the Pizigani, it had not the Catalan style Gulf of Kos the Medici atlas had. Further, the atlas is dated to 1351 by a calendar it contains on the first page. But the shape of Africa looked more modern and so this calendar is by some authorities no longer accepted as a valid date mark. The atlas is today suspected by the style of letters to be of 15th century origin. Pujades (2007). But anyway a common link between the early portolans seems very probable.
- "wahrscheinlich bald nach 1204". Fischer, Theobald: "Ăśber italienische Seekarten und Kartographen des Mittelalters." in: Zeitschrift der Gesellschaft fĂĽr Erdkunde, Vol. 17, Berlin (1883), p. 25
- "Von diesem Gesichtspunkte aus ist es zu beurtheilen, wenn wir auf der Karte der Pizigani von 1367 über Konstantinopel eine vergoldete Krone mit zwei an einem Stock vereinigten Flaggen finden, deren eine fünf Kreuze, die andere den geflügelten Löwen von San Marco trägt, womit also die Herrschaft der Kreuzfahrer und der Venezianer über Konstantinopel seit 1204 bezeichnet werden soll.
- Es wird dadurch sehr wahrscheinlich, dass die Pizigani, welche durchaus nicht als wissenschaftliche Kartographen anzusehen sind, für diese Gegend eine Vorlage hatten, welche jene Zeichen enthielt und somit in der Zeit von 1204-1261 angefertigt sein musste, gewiss nicht später.
- Dass ein venetianischer Kartograph nach 1261 und vollends in der zweiten Hälfte des 14. Jahrhunderts, wo längst die Genuesen in Konstantinopel allmächtig waren, diese Zeichen auf einer Karte neu angebracht haben sollte, wenn er sie nicht auf einer Vorlage fand, ist nicht gut anzunehmen. Es kann uns dies aber auch als Anhalt dafür dienen, dass es schon vor 1261 loxodromische Karten gab." Fischer (1886), p. 91
- It is one of three main points of argument in: Arentzen, Jörg-Geerd: Imago Mundi Cartographica: Studien zur Bildlichkeit mittelalterlicher Welt- und Ökumenekarten unter besonderer Berücksichtigung des Zusammenwirkens von Text und Bild, Ph.D Thesis Münster University 1983, München (1984). p. 279
- Fischer (1883), p. 36
- Hennig: Terrae Incognitae, Vol. 4, (1956), p. 94
- Cortesao, History of Portuguese Cartography, 2:72 (note 3). Acc. Campbell (1987), p. 410
- Cortesao, Armando: History of Portuguese Cartography, 2; acc. Campbell (1987), p. 410
- Genzmer, Felix: Die isländischen Erzählungen von den Winlandfahrten, in: Beiträge zur Geschichte der deutschen Sprache und Literatur, Volume 1944 (67), (here). Genzmer mentioned several sources for further voyages in c. 1125, c. 1150, c. 1200 and four Sagas from the 13th century.
- Hennig (1953), p. 346
- If Hennigs reading of Hercules is right it could be a hint by the Greek Atlantis legend of a continent beyond the pillars of Hercules. If the others were right, Antilia was always suggested to be a link to Vinland or new land beyond the Atlantic.
- A record of Torvald Eiriksson's voyage down there in Prytz (1991), pp. 18ff. In 1327 the pope's tithe collector in Norway signed a receipt for a bowl with a silver base, the upper part of which was a palm nut "from the other side of the ocean". For this purpose the nut had to be unrotten and therefore arrived by ship from Florida or further south. Prytz (1991), p. 70
- Hennig (1952) pp. 384ff
- The distortion is at least 26 + 9 = 35Â %. A ship that follows the northern coast of the Mediterranean will add further errors by each direction change and by dead reckoning navigation errors too. That would add much to the 35Â %. If planimetric maps were compiled over the whole Mediterranean, by such a compilation considerable further error would be added. As final result one would expect instead of 1.1Â % an error in the 100Â % range like Grosjean found for a 15th century portolan map of western Africa.
- Grosjean (1979), p. 37
- The island are well drawn on the large repro by Jomard but not visible on full chart images. But on other parts of the chart the ink was too faded out to be visible on such images too.
- There is agreement between Jomard and later images. The position and shape of Kos island is improved on later portolans too. It was such very wrong that it could only be a medieval addition too.
- The Catalan of G. Soler (1368-1386) seems between the first and the second shape class.
- The Gulf of Kos in 2 lines wide corresponds to 23 km / 2 = 11.5 km for the line wide. The Cape Bon in 3 lines wide corresponds to 27 km / 3 = 9 km for the line wide. So the 10 km is a virtual line between the blue 3 and the red 2 in the diagram.
- The lowest possible ink line may be below 0.1 mm


Comentaris publicats
Afegeix-hi un comentari: